


#Stock 13: Boot Barn - Short
Peak Cycle Value Trap

***COMPANY
Boot Barn is the largest Western lifestyle retailer with 459 stores across 45 states. BOOT has executed aggressive 15% annual expansion during the Western fashion trend peak driven by Yellowstone popularity and celebrity endorsements. However, multiple structural headwinds are converging at peak valuation levels, creating a compelling short opportunity.

Recent Stock Performance: Up 101% LTM, trading near 52-week highs despite concerning fundamentals. Stock has been driven by Western trend momentum and execution story, but multiple warning signals suggest inflection approaching.

**Revenue Generation Model
Boot Barn operates a specialty retail model with multiple revenue streams:
Footwear (47% of sales): Cowboy boots, work boots, casual boots
Average selling price: $150-300 per pair
Gross margin: 40-45% (highest margin category)
Apparel (36% of sales): Western shirts, jeans, hats, accessories
Average selling price: $50-150 per item
Gross margin: 35-40%
**Channel Mix
Physical Stores (83% of sales): 459 locations averaging 7,500-10,000 sq ft
E-commerce (17% of sales): bootbarn.com, sheplers.com, countryoutfitter.com


**Store Economics
Average store generates $4.2M in annual revenue
Store-level EBITDA margins: 15-20%
New store payback period: 2-3 years
Lease terms: Typically 10-year initial with 5-year options
**Is it a Good Business?
Decent business during favorable cycles, but inherently cyclical with fashion/economic sensitivity limiting sustainable competitive advantages.
**Strengths
High Returns: ROIC of 15%, FCF margin at peak 7% vs. 4% L5Y
Cash Generation: Strong FCF conversion FY24 (80%+ of net income) - sustainable?
Scalable Model: Proven unit economics across geographic markets
Inventory Velocity: Healthy turns of 2.5x annually
**Business Quality Concerns**
Fashion Sensitivity: Subject to trend cycles and consumer preference shifts
Geographic Concentration: Limited international diversification
Capital Intensive: Requires continuous investment for store expansion
Economic Sensitivity: Discretionary spending vulnerability
***INDUSTRY
**TAM: $68B+Western Wear Market
Organic Growth Rate: 3-5% annually (mature, cyclical fashion category)
Seasonality: Q4 (holiday) and Q2 (spring/rodeo season) strongest
Consolidation: Moderate - fragmented market with regional players, Boot Barn leading consolidation
**Retail Industry Trends
Key Headwinds: Fashion cycle maturity, e-commerce disruption, sustainability concerns, economic sensitivity
Key Tailwinds: Rural lifestyle adoption, functional workwear demand
Real Estate Costs: Rising lease expenses in desirable locations
**Industry Margins
Currently at peak cycle levels (~37% gross margin) vs. historical average of 32-35%. Specialty retail typically sees 200-400bps margin compression during downturns.
**Boot Barn's Position
Clear market leader with 10%+ market share, but facing saturation in prime markets as expansion targets shift to suboptimal locations. Brand Portfolio: Exclusive brands (Cody James, Idyllwind) providing differentiation vs competitors.
***Major Threats to the Company
1. Fashion Cycle Risk (HIGH PROBABILITY)
Threat: Western wear trend reaching maturity/decline phase
Impact: 30-50% revenue decline potential over 2-3 years
Timeline: 12-24 months for initial signs, 2-4 years for full cycle
2. Market Saturation (MEDIUM-HIGH PROBABILITY)
Threat: Running out of viable expansion markets
Impact: Growth deceleration from 15% to 3-5% annually
Timeline: Already emerging in some markets, 18-36 months for broader impact
3. E-commerce Disruption (MEDIUM PROBABILITY)
Threat: Online competitors capturing market share
Impact: Margin compression and store traffic decline
Timeline: Ongoing pressure, accelerating over 3-5 years
4. Economic Recession (MEDIUM PROBABILITY)
Threat: Consumer discretionary spending cuts
Impact: 20-40% revenue decline during recession
Timeline: Dependent on macro cycle timing
***THESIS POINTS
1. Extreme Valuation at Fashion Cycle Peak - Current Metrics Signal Overvaluation
P/E Ratio: 27-29x vs. specialty retail average of 15.7x (72% premium)
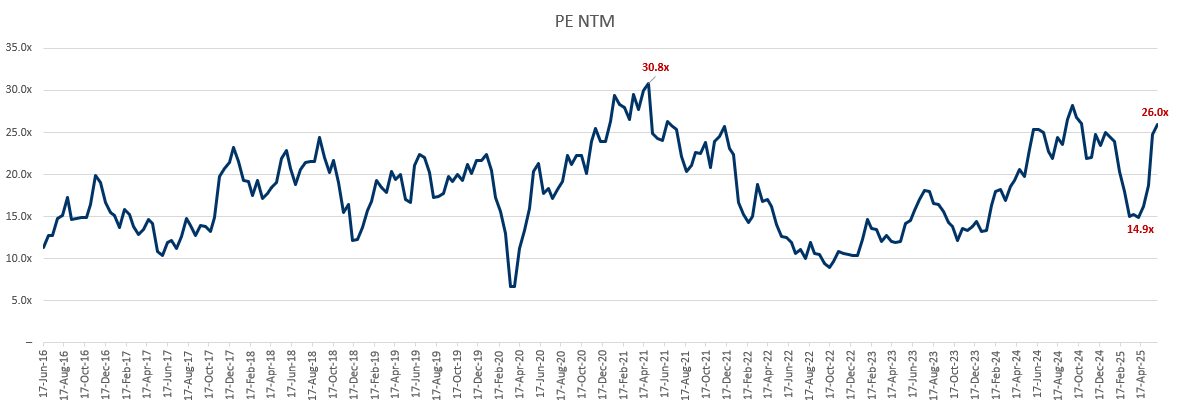
28% above 10-year historical average P/E of 21x
Multiple valuation services flag "significantly overvalued" vs. intrinsic value
Peak Earnings Risk: 37.1% gross margin represents cyclical high, 200-400bps above historical average of 34-35%. Specialty retail typically sees significant margin compression during fashion trend maturity.
2. Fashion Trend Approaching Maturity - Western Wear Cycle Evidence:
Google Trends down 35% from 2023 peak for "western wear" searches
Historical Pattern: Fashion cycles typically last 5-7 years; Western mainstream adoption began 2019-2020
Celebrity Effect Waning: Yellowstone series concluding, Beyoncé/Taylor Swift Western phases passing
Social Media Decline: Decreasing hashtag engagement and influencer adoption
Demographic Shift Risk: Urban adoption proving less sticky than rural core customers, with younger demographics gravitating toward sustainable/ethical fashion alternatives.
3. Geographic Saturation Constraints - Mathematical Reality:
459 stores across 45 states = 10+ stores per state avg. vs forecast 15+ stores per state (street forecast 674 stores in FY28E)
Prime market penetration: Optimal Western/rural markets approaching 70% saturation
Store productivity declining: New locations generating 70-80% of mature store revenue
Early Warning Signals
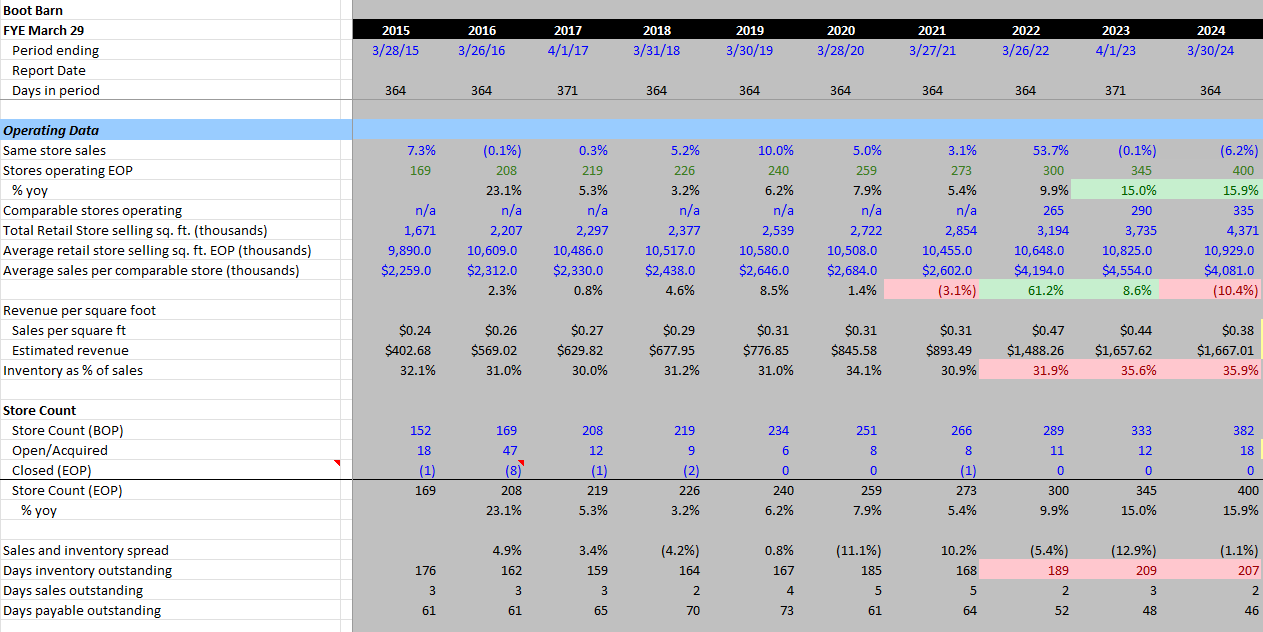
Inventory turns declining from 2.8x to 2.5x as expansion accelerates
Inventory as % of sales rising from 30% FY 21 to 35.9% FY24
Management acknowledging tougher site selection in recent calls
#4. Intensifying Competitive Pressures - Multi-Front Competition:
Amazon Western expansion: Increasing selection with price advantages
Fast fashion entry: Shein targeting trend-driven occasional buyers
E-commerce decline concerning: Boot Barn's online sales dropped from 17% to 11% of total (opposite of retail trends)
***RISK POINTS
Continued Fashion Trend Extension (25% probability) - Western aesthetic could persist longer than expected
Mitigant: Even if extended, current valuation prices in perfection; limited upside at these levels
Flawless Execution (20% probability) - Management continues perfect expansion execution
Mitigant: Geographic constraints are mathematical reality; law of large numbers working against them
Economic Resilience (15% probability) - Consumer spending remains robust despite macro headwinds
Mitigant: Western wear is discretionary; economic slowdown would disproportionately impact BOOT
Downside Scenario: 35-50% decline over 12-18 months as multiple compression meets earnings deceleration
***VALUATION STARTING POINTS & 3Y ALGO
Current Valuation Metrics: Boot Barn is trading at 26.6x NTM P/E, 18.6x EV/EBITDA and 2.3% FCFY FY24. These metrics represent significant premiums: 72% above specialty retail P/E average and 25-40% above EV/EBITDA peers
**Valuation Compression Scenario
Target multiple: 19x P/E (normalized specialty retail level) vs. current 26.2x
Combined effect: Multiple compression + earnings decline = 35-40% downside to $95-110 target
Timeline: 12-18 months for primary re-rating as fashion cycle headwinds become apparent
***OUR ESTIMATE vs. STREET
**Bear Case 3-Year Projections (Our Base Case)
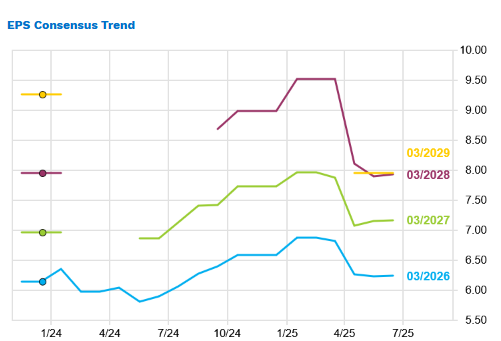
We expect Boot Barn to deliver 8% revenue CAGR (vs. Street's 12%+) as fashion cycle matures and geographic expansion hits constraints
Adjusted EBITDA decline of 10% driven by margin compression from 18.6% to ~15% as competitive pressures intensify
EPS contraction of 15-20% as operating leverage works in reverse during demand deceleration
No meaningful M&A contribution as optimal acquisition targets exhausted and valuations prohibitive

Current Consensus:
93% of analysts rate Strong Buy/Buy - extreme bullish sentiment
Short Interest: Only 7.6% - limited bearish positioning
Recent Institutional Activity: Net buying through Q1 2025
Valuation Services: Multiple firms flag "significantly overvalued"
Key Variance Drivers:
Street assumes margin expansion; we expect compression
Consensus projects continued 12%+ growth; we forecast deceleration to 6-8%
Market ignores fashion cyclicality and saturation risk
***CATALYST PATH
Near-Term Catalysts (3-6 months):
Q1 2026 Earnings (August 2025): First quarter with difficult comparisons and potential guidance cut
Holiday 2025 Performance: Critical test of demand sustainability during peak selling season
Store Productivity Data: Management commentary on new store performance likely to disappoint
Medium-Term Catalysts (6-18 months):
Same-Store Sales Deceleration: Comp store growth likely to turn negative as fashion cycle matures
Margin Compression: Competitive pressure and cost inflation forcing gross margin contraction
Multiple Compression: Valuation re-rating as growth story breaks down
Specific Trigger Events:
Management guidance reduction on growth or margins
Inventory buildup indicating demand softening
Competitor announcements of Western wear expansion
Celebrity/cultural shift away from Western aesthetic
This investment thesis has been prepared by Whitelight Capital and Bret Carlson for informational purposes only. This publication contains forward-looking statements and projections that involve inherent risks, uncertainties, and assumptions about future market conditions and performance. Actual investment results may differ materially from those presented or anticipated in this analysis
Investor Contact: investors@whitelightcapital.com
***Annexes
Peak vs Trough Margin

Key Drivers based on Factset Consensus

Tactical Risk/Reward
